![]()
| Home | People | Research | Publications | Demos |
| News | Jobs |
Prospective
Students |
About | Internal |

|
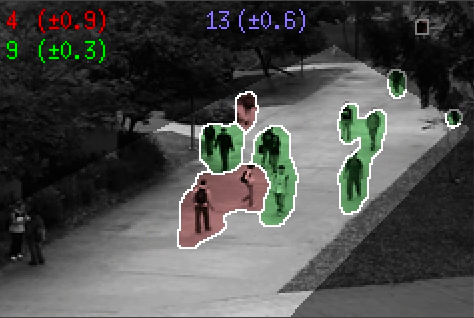
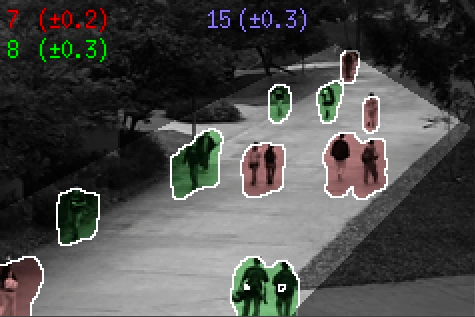
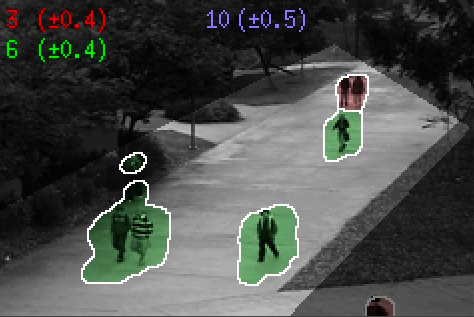
These are demo videos for crowd counting using low-level features and Bayesian regression. The video is available in Quicktime format (H.264).
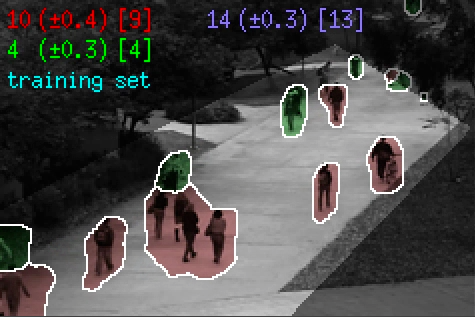
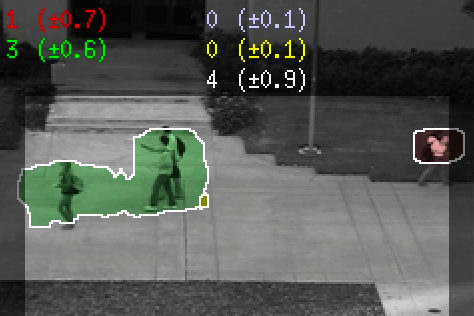
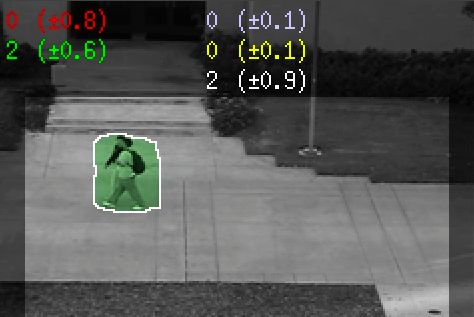
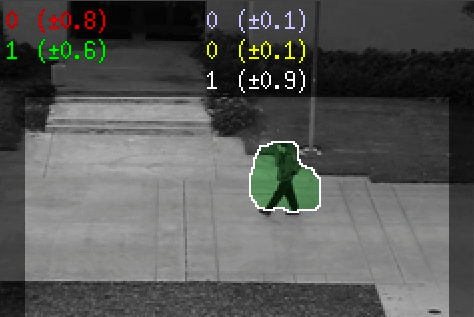
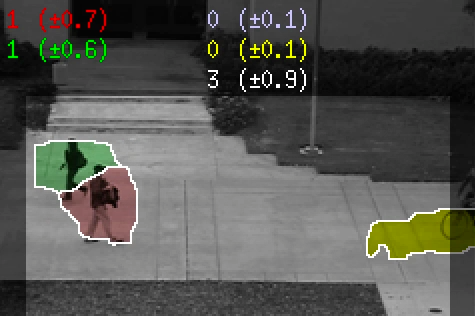
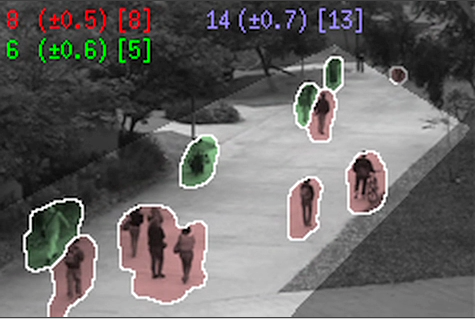
This are the video results for the Peds1 dataset, which contains 3 motion classes (away, towards, and scene).
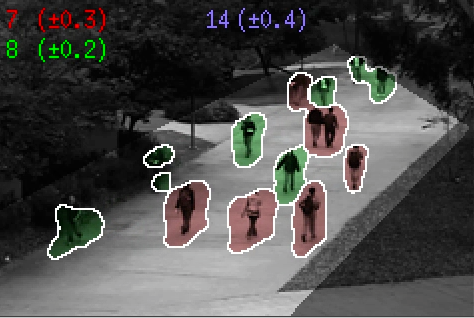
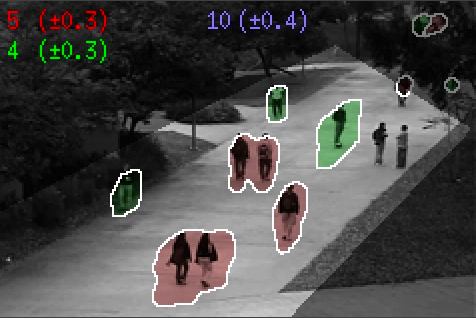
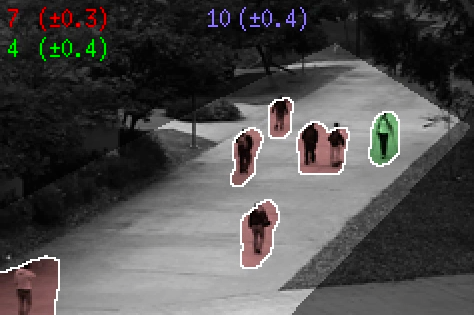
The red and green segments are the
"away" and "towards" components of the crowd. The estimated crowd
count for each segment is shown in the top-left, with the (uncertainty)
and the [ground-truth]. The prediction for the "scene" class, which is the total number of people in the scene, is shown in
the top-right in blue. The ROI is also highlighted.
Results on 4000 frames
These are results on the 4000 frame with ground-truth counts.
The system was trained on 1200 frames.
[mov (16 MB)]
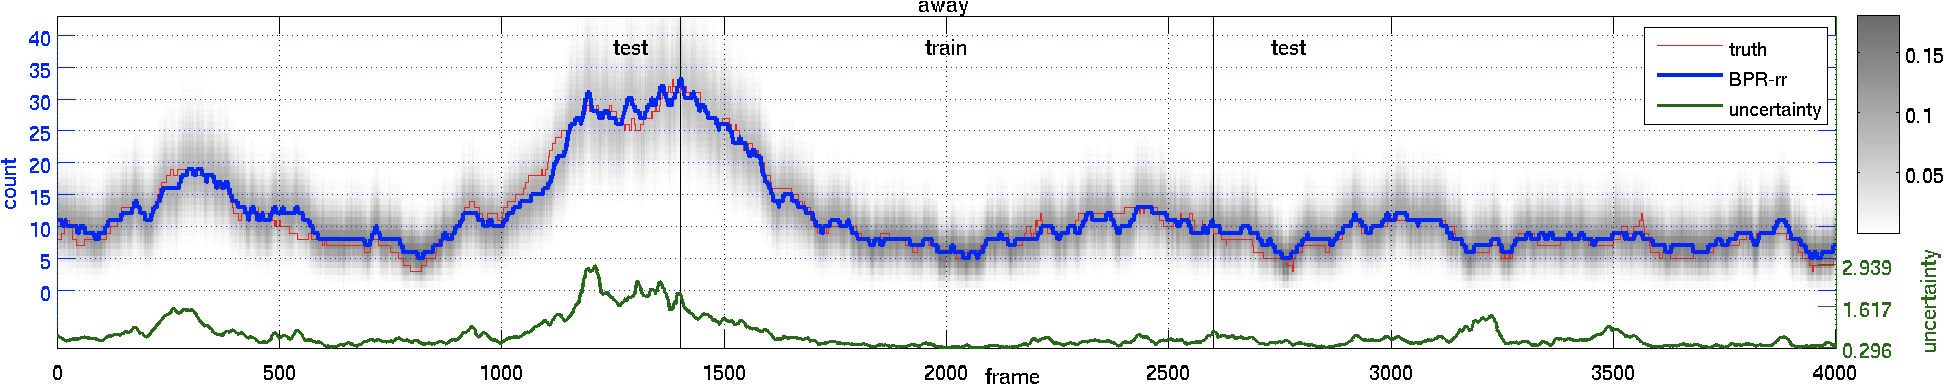
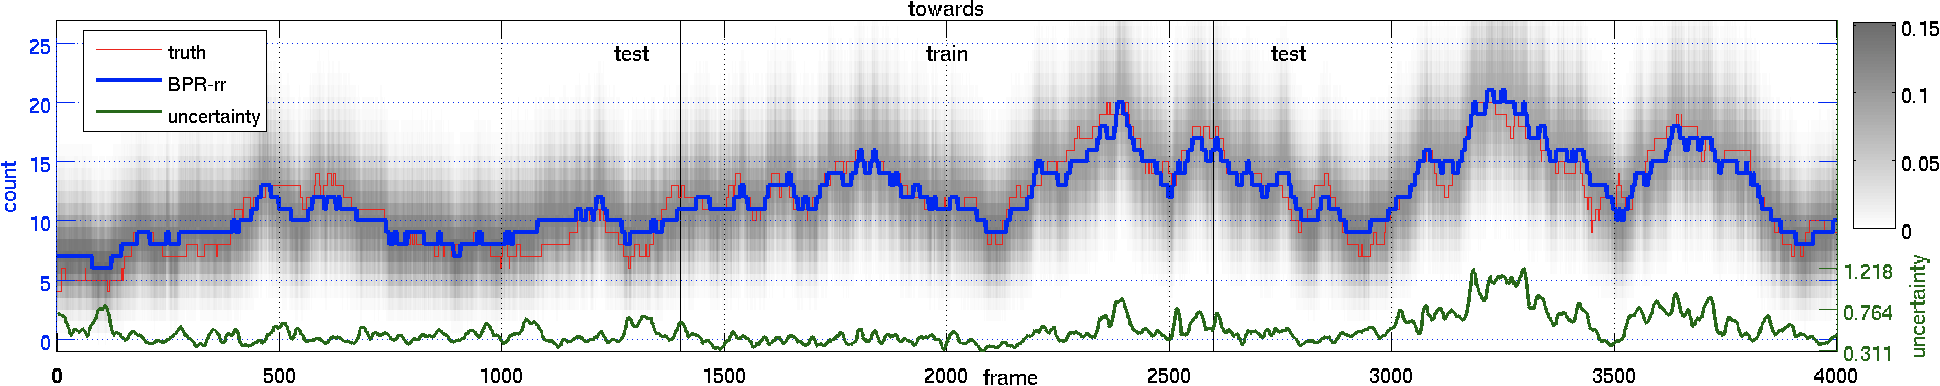
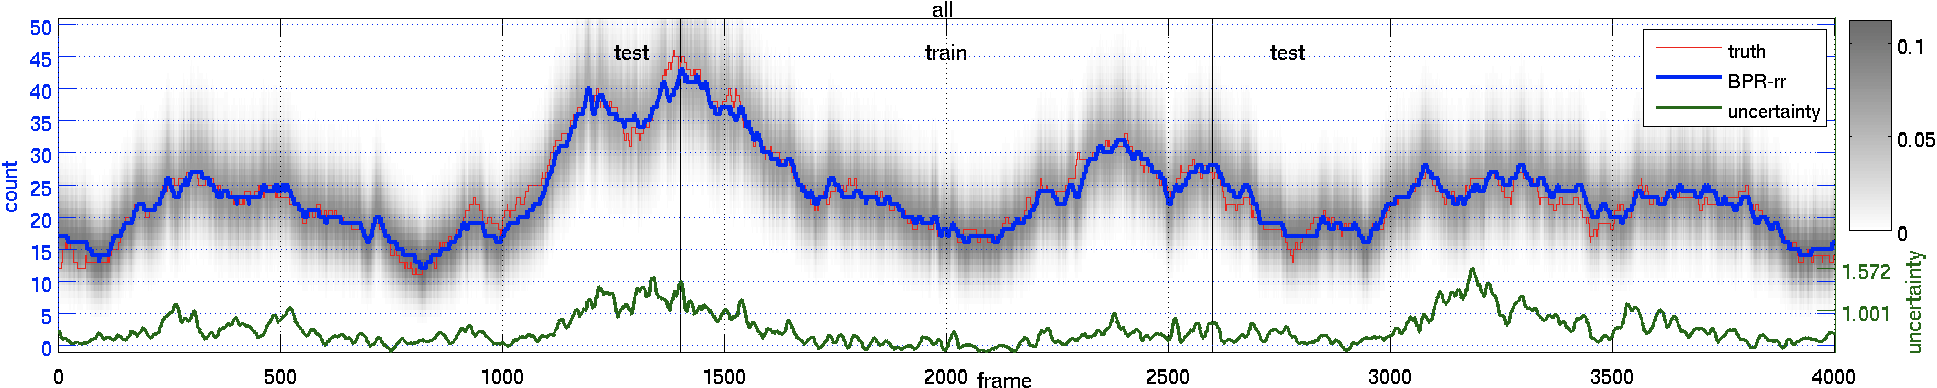
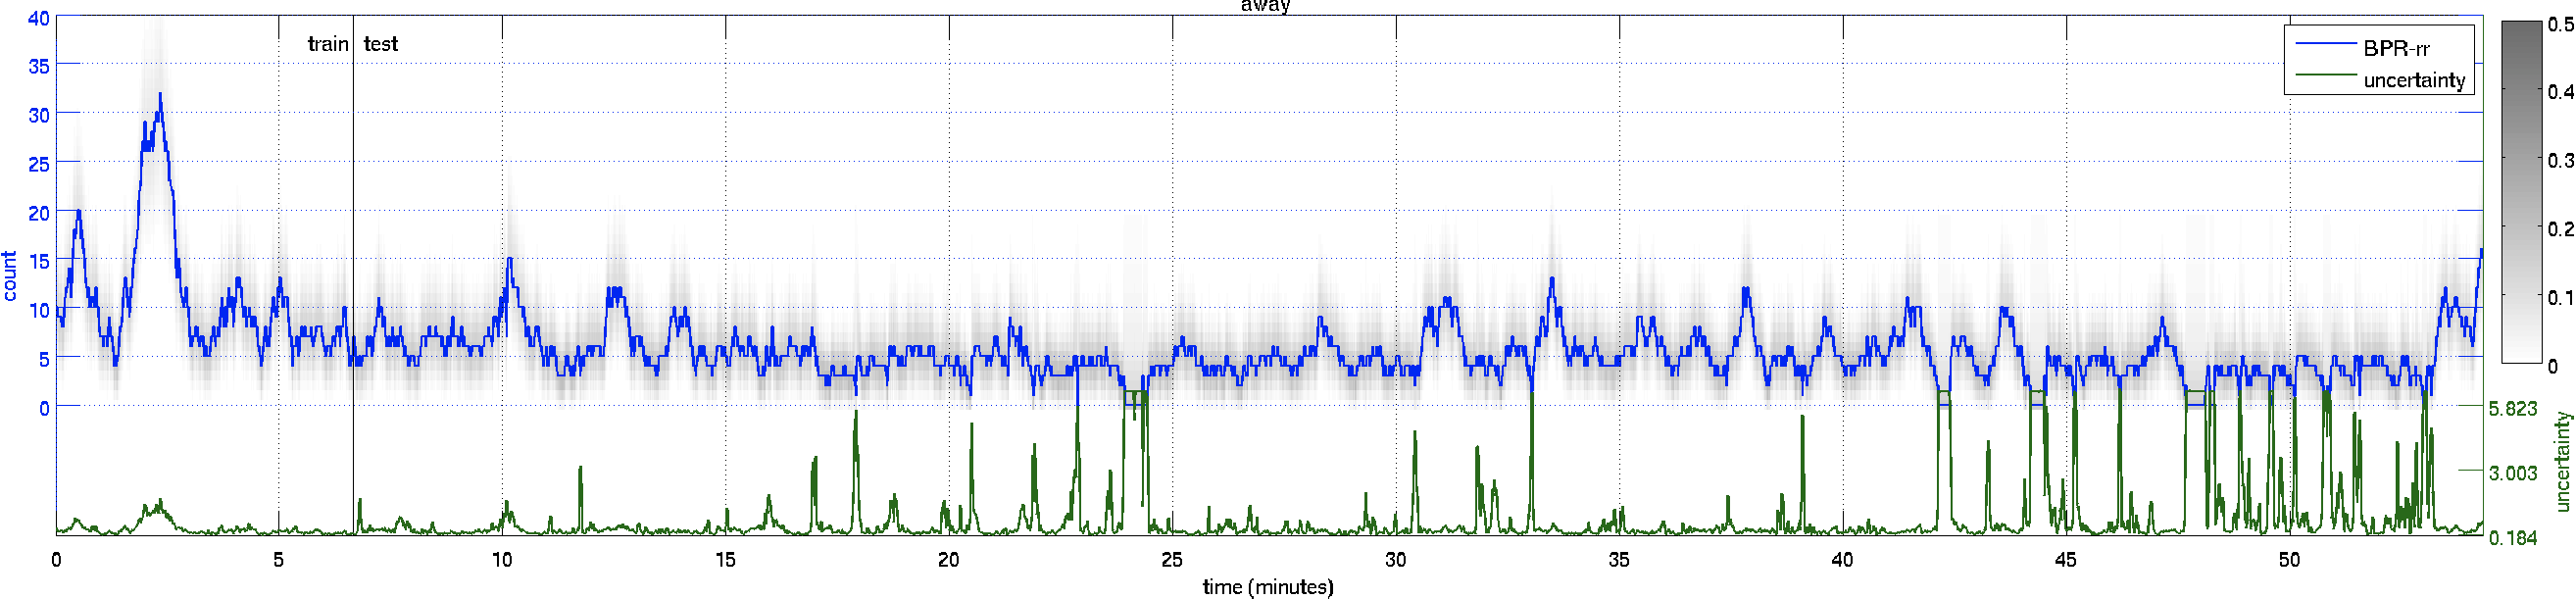
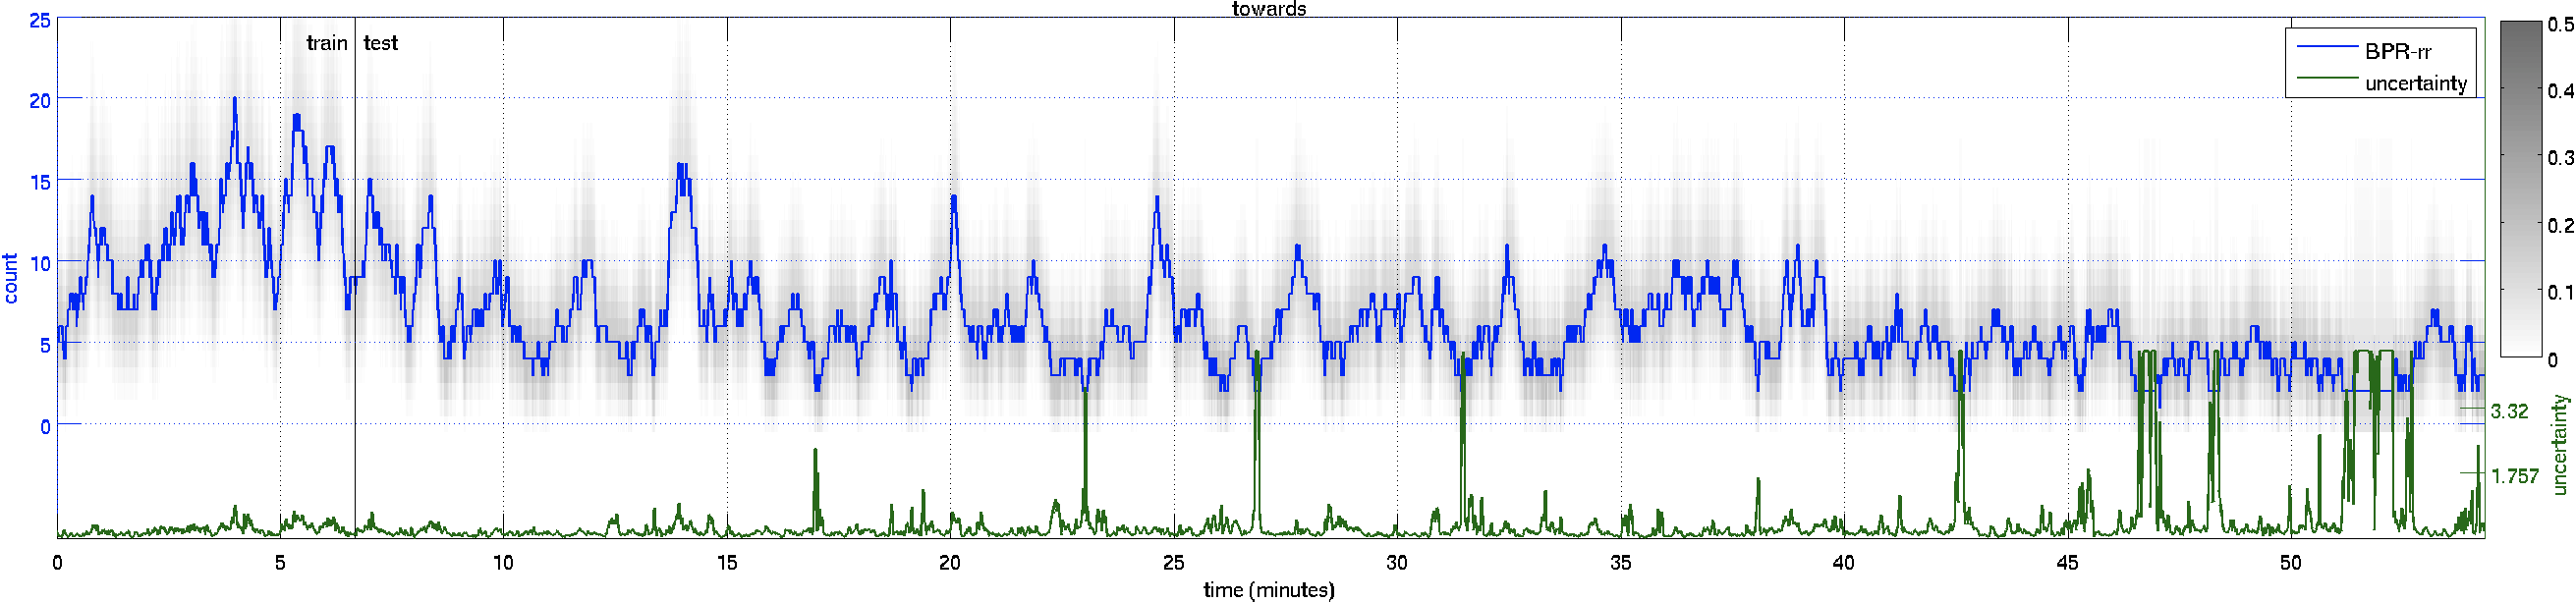
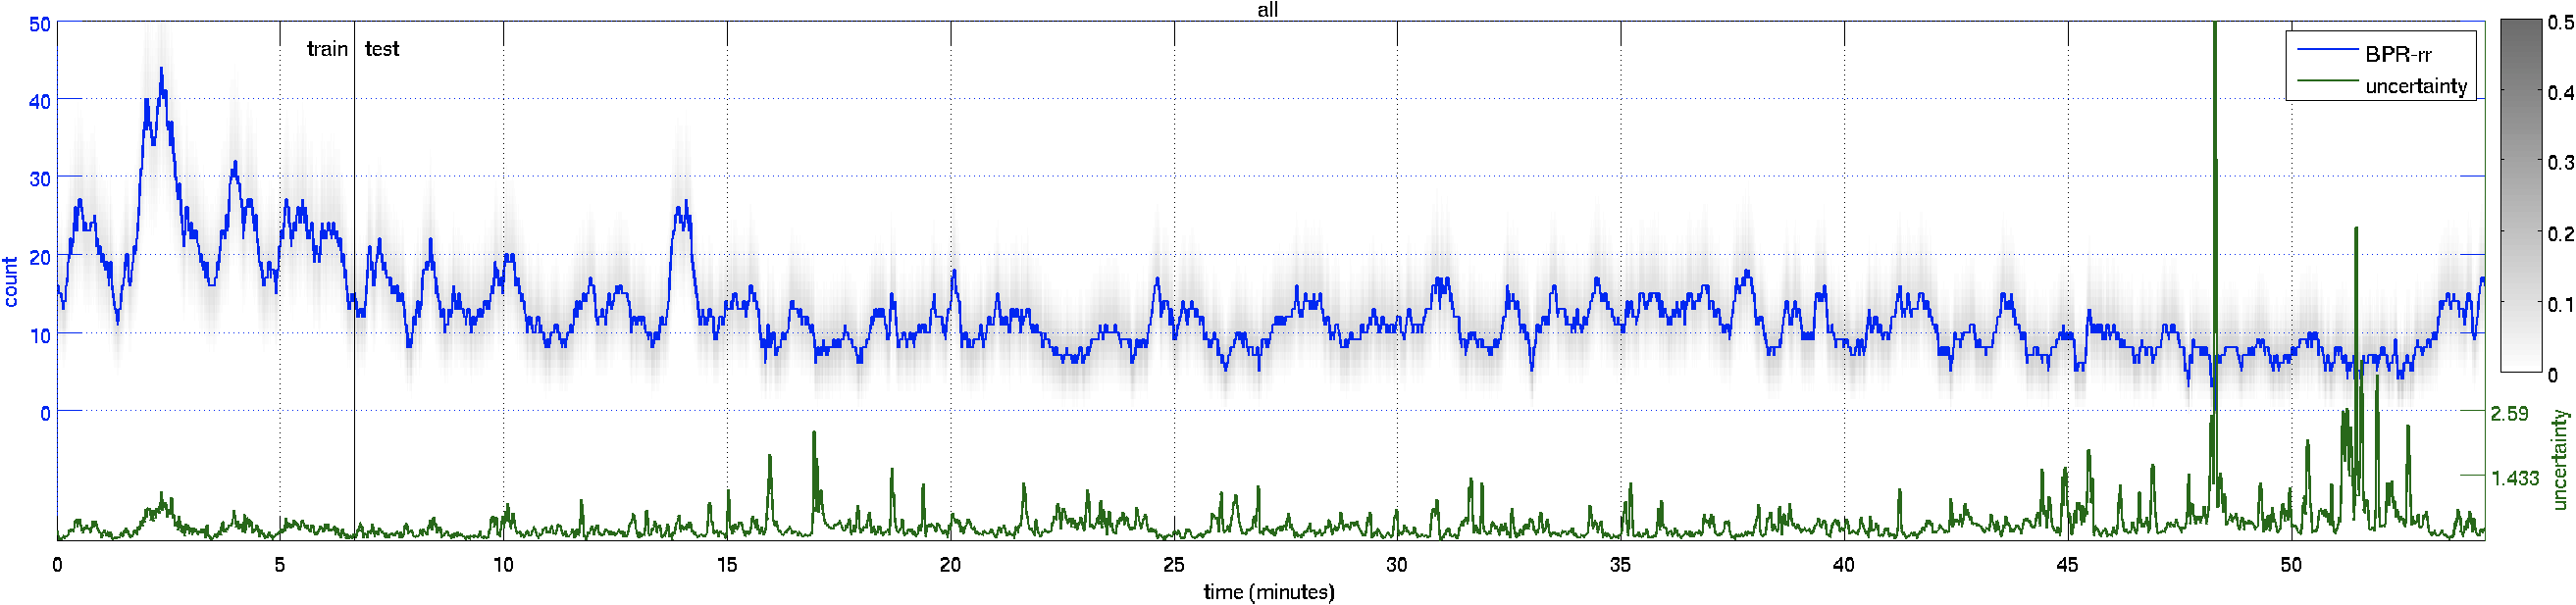
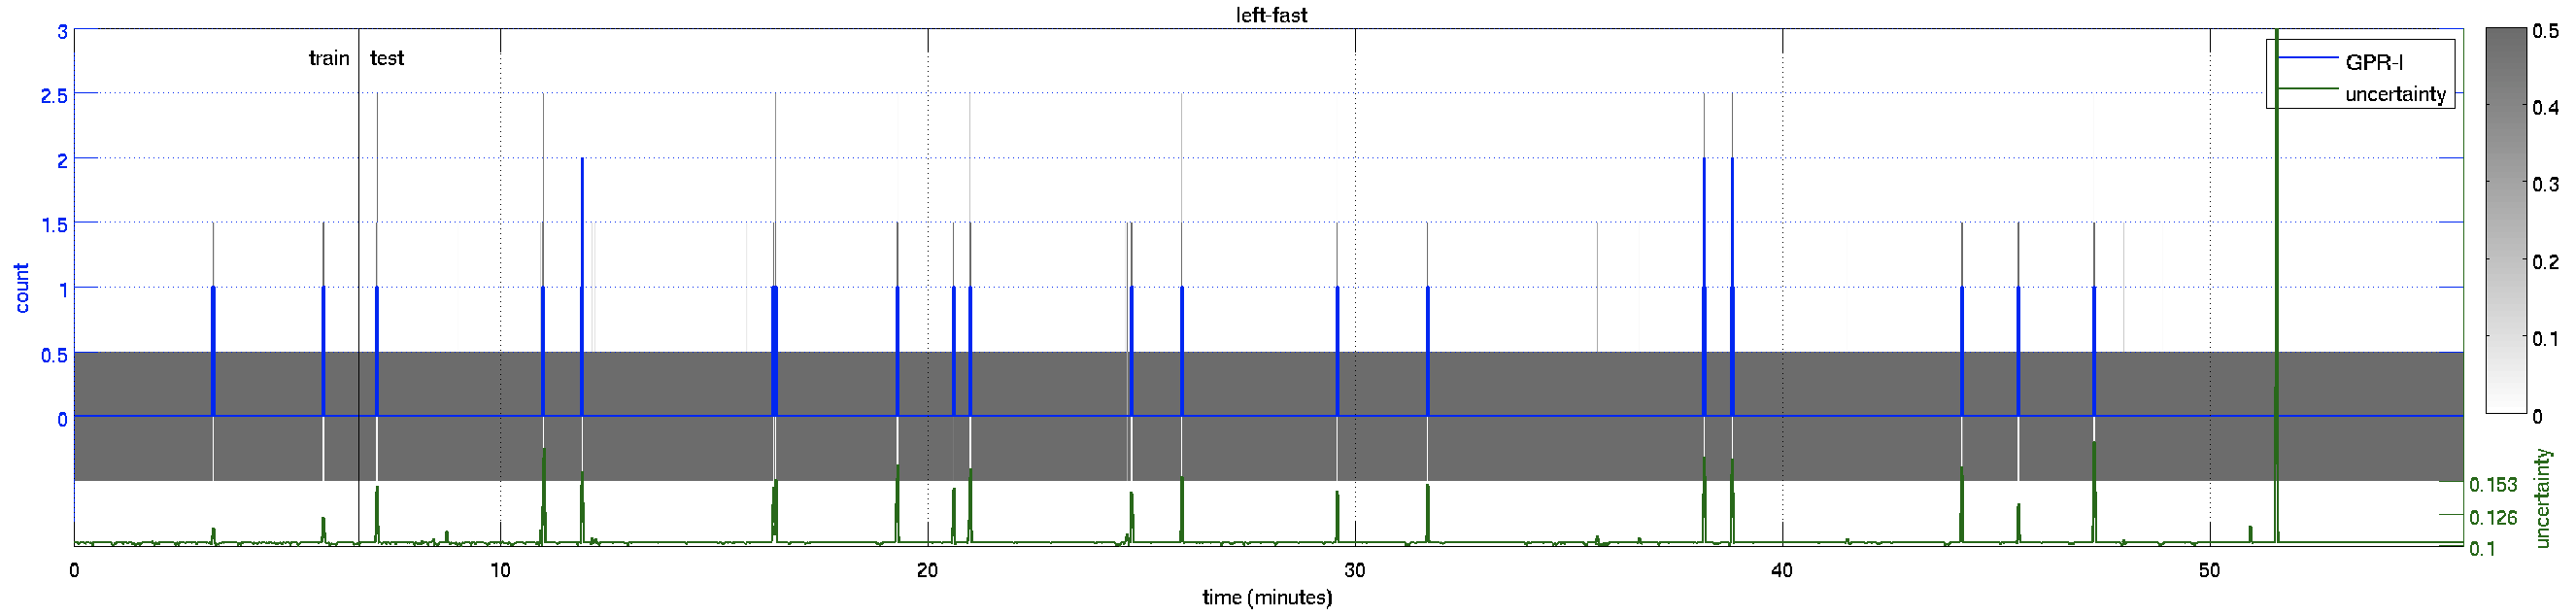
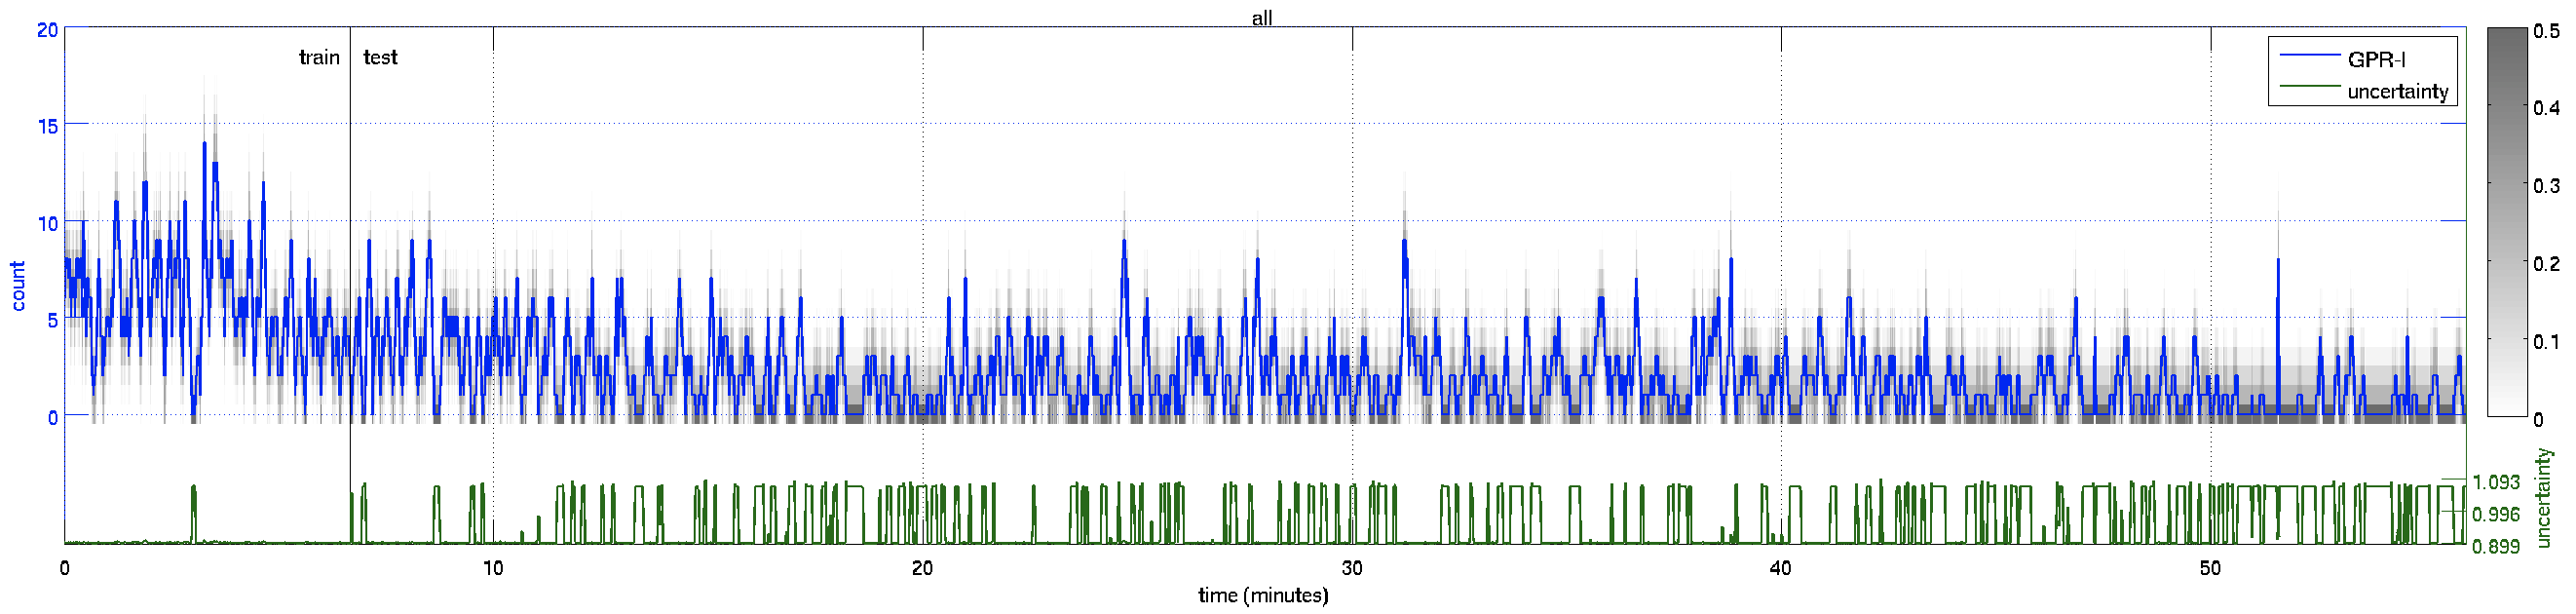
These are the plots of the counts over time for the 4000 frames.
Gray levels indicate probabilities of the predictive distribution.
Results on full video
The system was trained on 2000 frames with ground-truth, and tested on the remaining 50 minutes of video.
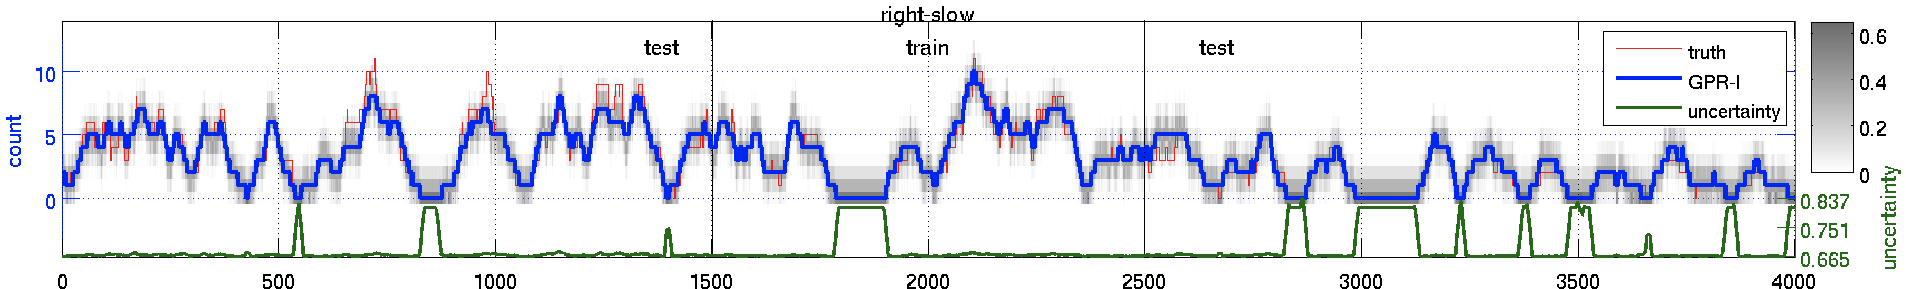
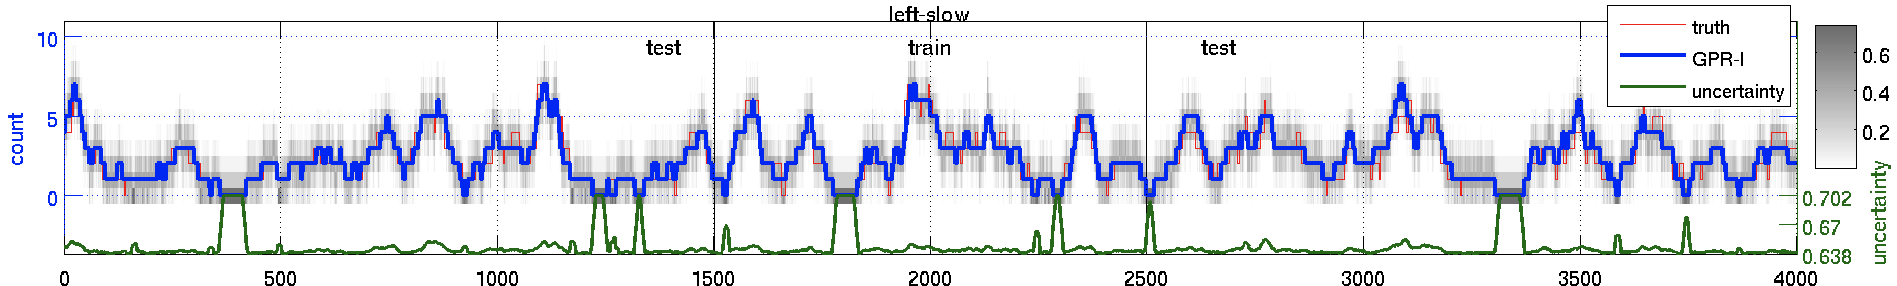
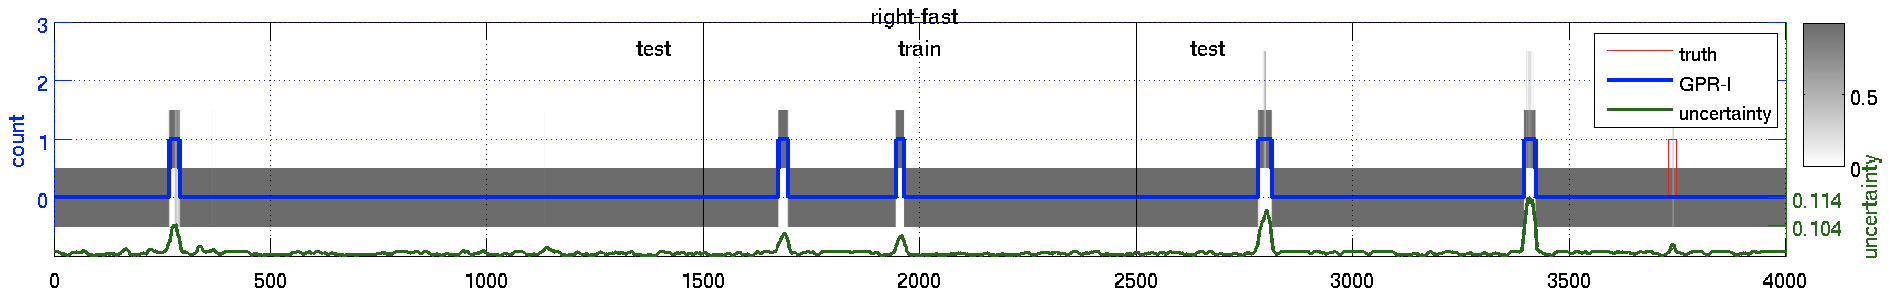
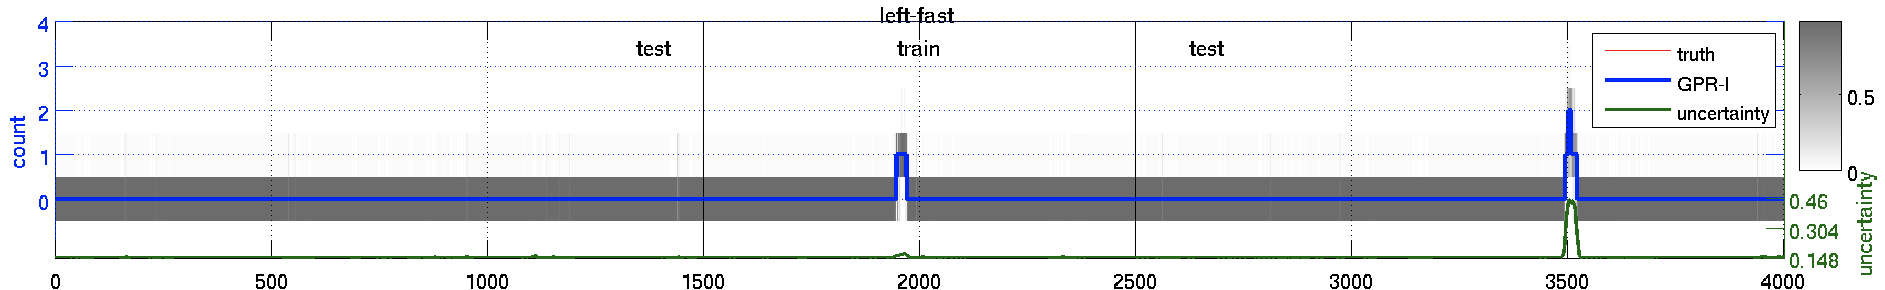
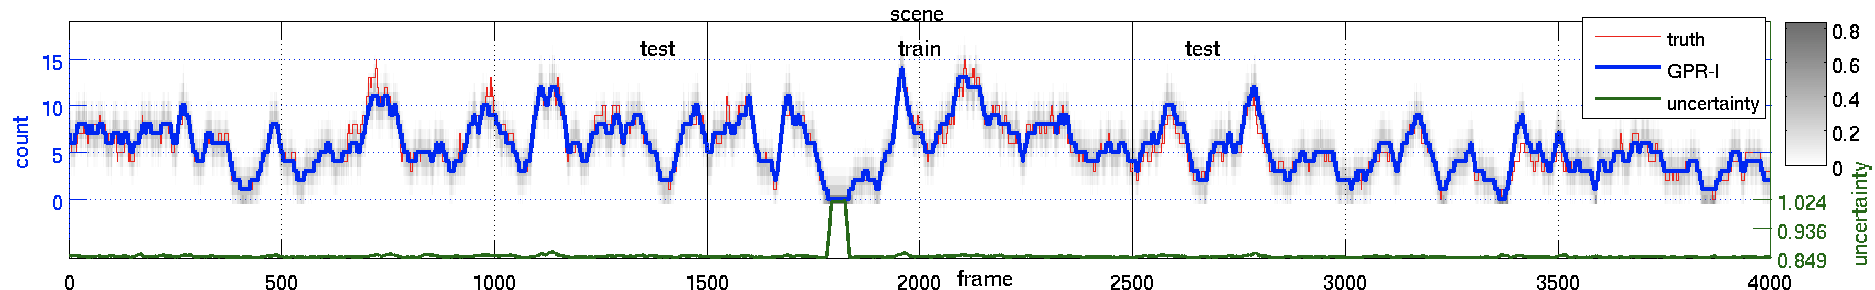
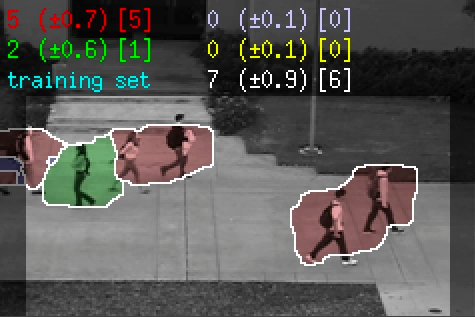
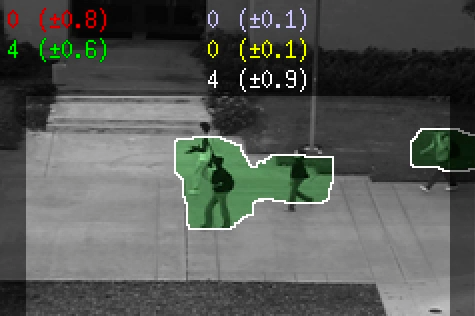
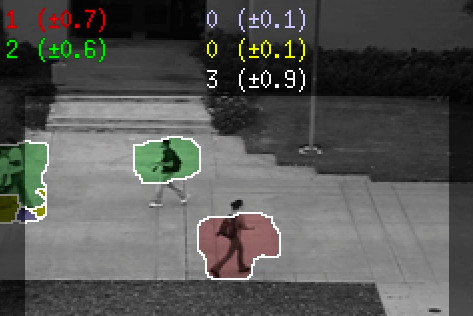
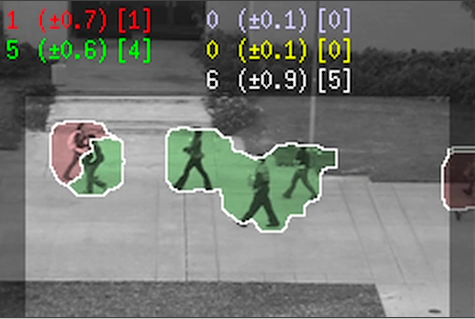
This is the video results for the Peds2 dataset, which contains 5 motion classes (left-slow, right-slow, left-fast, right-fast, and scene).
The red and green segments are
the "right-slow" and "left-slow" components of the crowd, the blue
and yellow segments are the "right-fast" and "left-fast" ones. The
estimated crowd count for each segment is shown in the top-left, with the
(uncertainty) and the [ground-truth]. The count for the "scene" class, which is the total number in the scene,
is shown in white text.
Results on 4000 frames
These are results on the 4000 frame with ground-truth counts.
The system was trained on 1000 frames.
[mov (16 MB)]
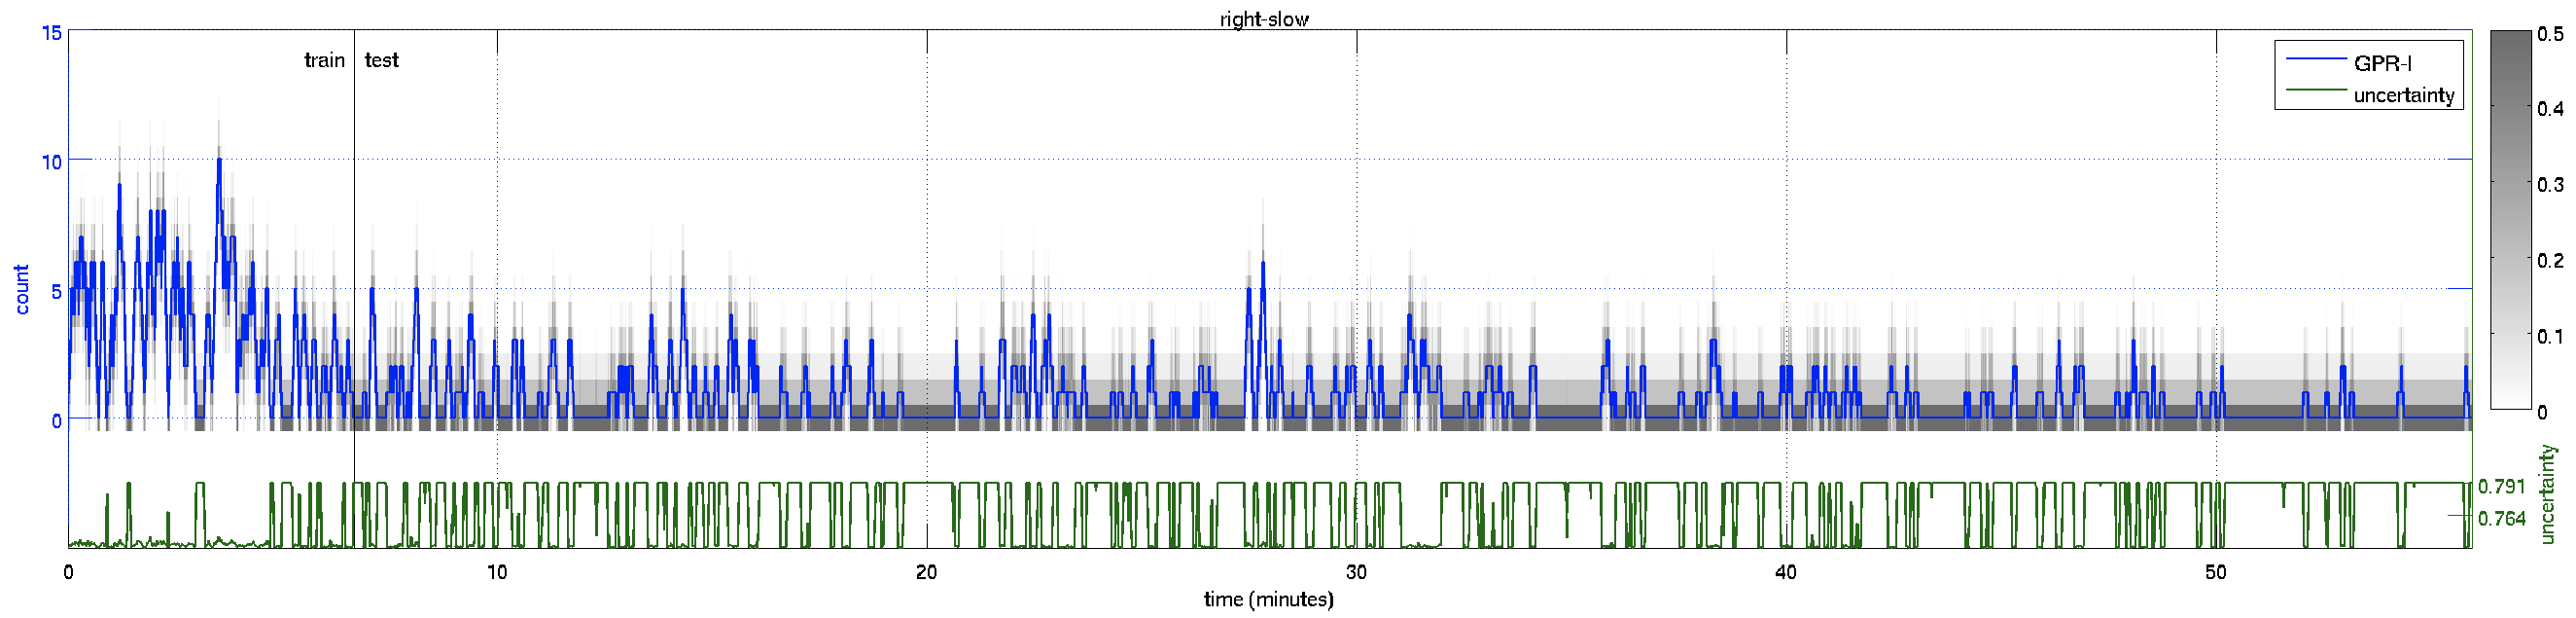
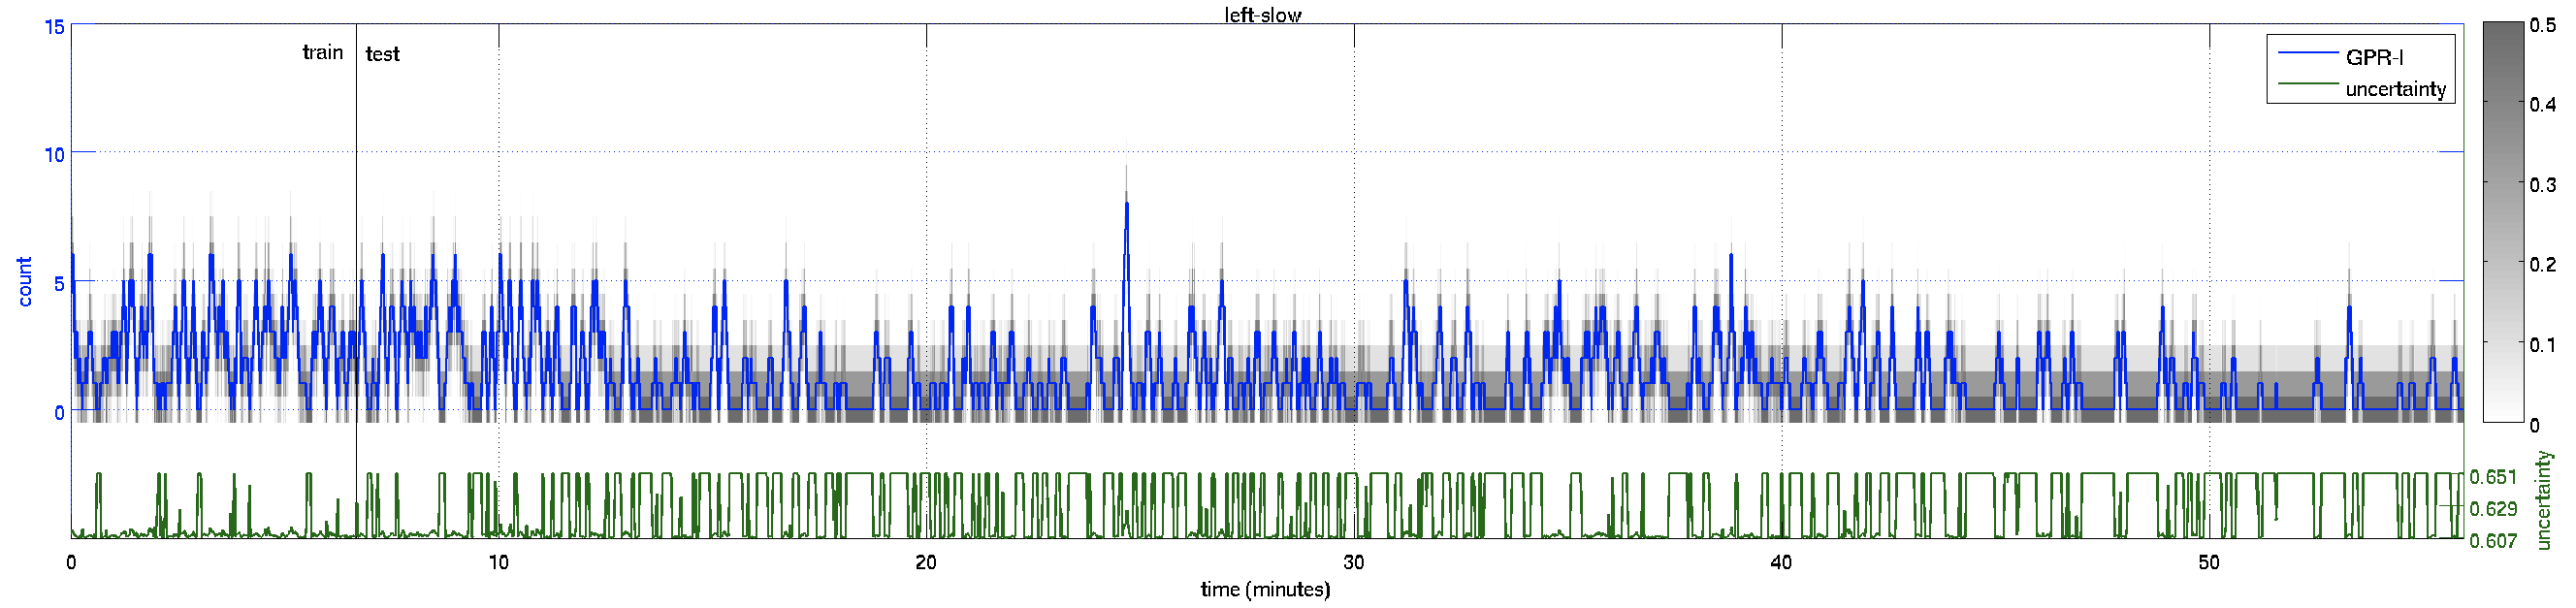
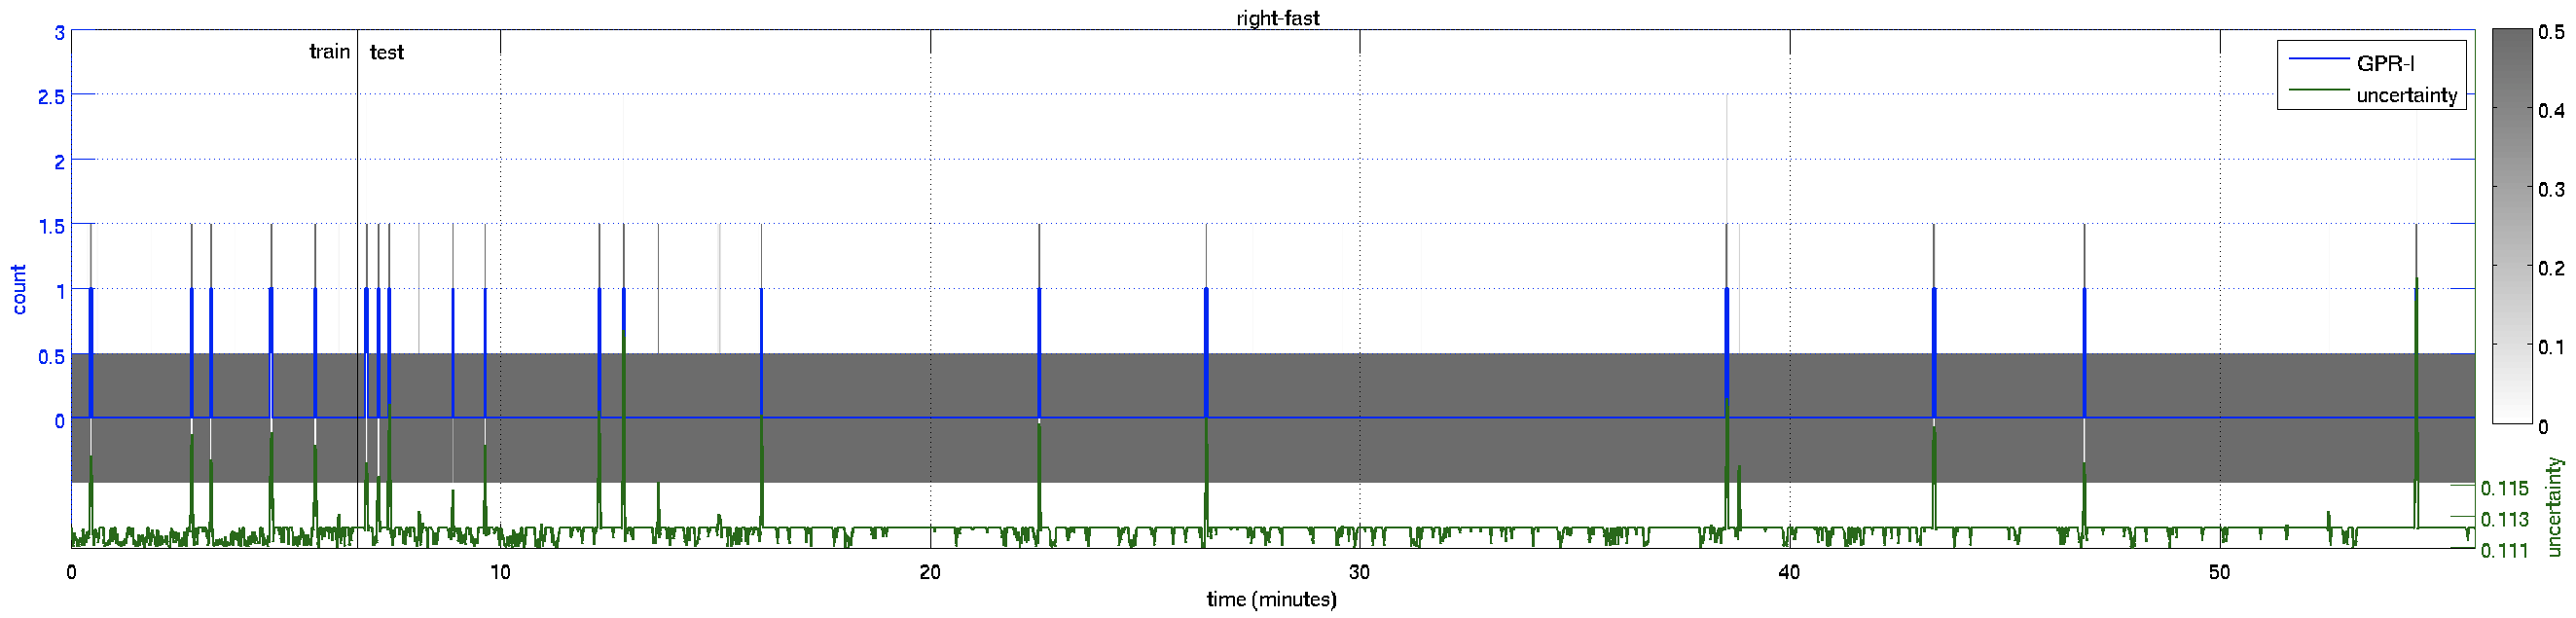
These are the plots of the counts over time for the 4000 frames.
Gray levels indicate probabilities of the predictive distribution.
Results on full video
The system was trained on 2000 frames with ground-truth, and tested on the remaining 50 minutes of video.
| ||||||||||||||||||||||||||||||||||||||||||||||||||||||||||||||||||||
![]()
©
SVCL