![]()
| Training Detector Cascade | |||||
 |
|||||
Detector cascade was first introduced by Viola&Jones (wikipedia). As shown above the detector is a sequence of simple and fast to complicated classifiers where each stage accept most of faces and reject some non-faces. Early rejection make the overall process very fast (real-time) and today this detector architecture is used in smartphones and digital cameras. In this project the problem of automatic and optimal design of embedded object detector cascades is considered. Two main challenges are identified: optimization of the cascade configuration, and optimization of individual cascade stages, so as to achieve the best trade-off between classification accuracy and speed, under a detection rate constraint. Two novel boosting algorithms are proposed to addressed these problems. The first, RCBoost, formulates boosting as a constrained optimization problem, which is solved with a barrier penalty method. The constraint is the target detection rate, which is met at all iterations of the boosting process. This enables the design of embedded cascades of known configuration without extensive cross-validation or heuristics. The second, ECBoost, searches over cascade configurations, to achieve the optimal trade-off between classification risk and speed. The two algorithms are combined into an overall boosting procedure, RCECBoost, which optimizes both the cascade configuration and its stages under a detection rate constraint, in a fully automated manner. |
|||||
| Comparision with state-of-the-art: | |||||
| Extensive experiments in face, car, pedestrian, and panda detection show that the resulting detectors achieve an accuracy vs. speed trade-off superior to those of previous methods. | |||||
 |
 |
||||
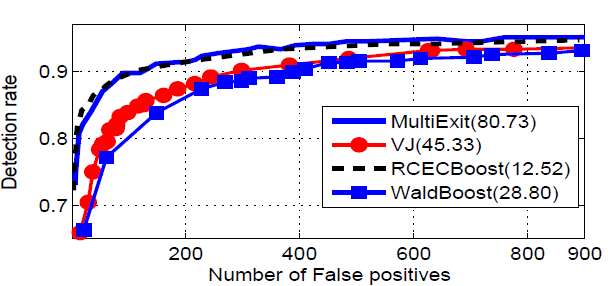
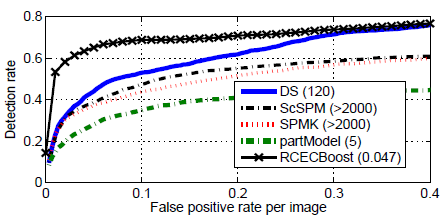
| Face detection: ROC of various face detectors on MIT-CMU face data. The legend shows the average detection complexity T of each method. | Panda detection: Detection rate vs FPPI. The numbers in the legend are the average detection times (seconds) per image. | ||||
 |
 |
||||
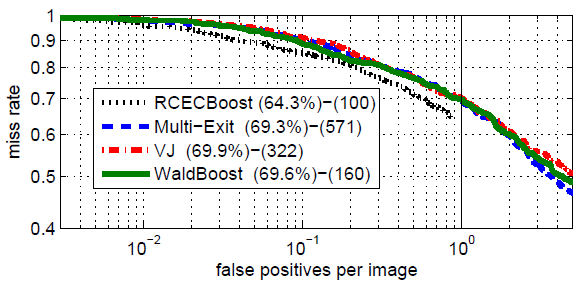
| Pedestrian detection:The legend shows the miss rate at one false positive per image (first value) and the average detection complexity T (second value). For more recent result on pedestrain detection please visit pedestrian detection project page. | |||||
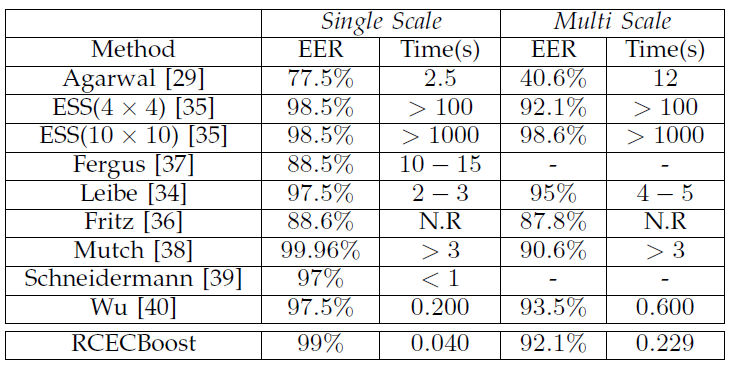
| Car detection: Comparison of car detectors on the UIUC dataset for single scale and multi-scale car detection (side-view). | |||||
| Demos: | |||||
| Download | Download | ||||
| Download | |||||
| For vidoe of detecting other objects please visit pedestrian detection project page and Scaling Rapid Obj. detection page. | |||||
| Related Publications: | |||||
|
|||||
![]()
Copyright
@ 2009 www.svcl.ucsd.edu
